FAO Yearbook highlights impact of disasters on agriculture
Disasters are estimated to have caused production losses in crops and livestock valued at $3.8 trillion between 1991 and 2021, corresponding to an average loss of $123 billion per year, or 5 percent of annual global agricultural GDP. FAO’s Statistical Yearbook 2023 shows that Asia has suffered the largest loss, reflecting its overall geographic size, followed by the Americas, Europe, Africa and Oceania.

 Join the RuralVoice whatsapp group
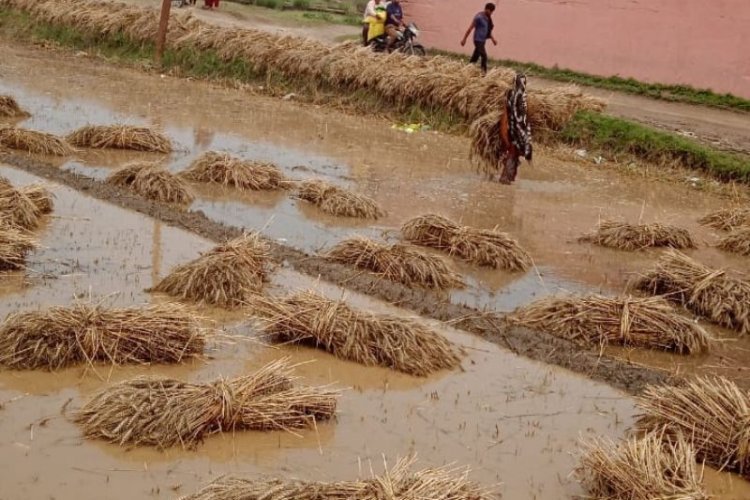
Disasters are estimated to have caused production losses in crops and livestock valued at $3.8 trillion between 1991 and 2021, corresponding to an average loss of $123 billion per year, or 5 percent of annual global agricultural GDP.
FAO’s Statistical Yearbook 2023 shows that Asia has suffered the largest loss, reflecting its overall geographic size, followed by the Americas, Europe, Africa and Oceania.
Even though Asia has the highest loss in absolute terms, it has a relatively small impact given the magnitude of its production. In contrast, Africa, the Americas and Europe appear more affected proportionally to their agricultural sector.
The annual data compilation offers insights to current global trends in food and agriculture. It carries latest trends in the world’s agrifood systems and highlights, for the first time, the impact of disasters on agriculture and the cost and affordability of a healthy diet.
Drawing on the wealth of information that FAO statisticians produce across the Organization, the publication offers a synthesis of the major factors at play in the global food and agricultural landscape.
The 2023 edition comprises well-organized data sectioned into four thematic chapters, covering the economic importance of agricultural activities; inputs, outputs and factors of production; implications for food security and nutrition; and agriculture’s impacts on the environment.
“Timely, accurate and high-quality data and statistics are the cornerstone of solid policy design, where decisions are based on hard evidence, and monitoring and evaluation rely on strong statistical systems.” said José Rosero Moncayo, Director of FAO’s Statistics Division in the foreword to the publication.
“This has become all the more critical as governments around the world commit to major sectoral and national development plans, as well as regional and global development agendas.”
An important highlight of this year's edition is the food loss percentage. It is the highest in sub-Saharan Africa (almost 20 percent in 2021) and the lowest in Northern America and Europe (9 percent). Food losses vary considerably from one region to another within the same commodity groups and supply chain stages.
The global estimate of the cost of a healthy diet in 2021 was 3.66 purchasing power parity (PPP) dollars per person per day, up 4.3 percent compared with 2020. The cost of a healthy diet increased by more than 5 percent in all regions except Northern America and Europe between 2020 and 2021, reflecting the rise in food inflation. More than 3.1 billion people in the world, or 42 percent, were unable to afford a healthy diet in 2021.
The global value added generated by agriculture, forestry and fishing grew by 84 percent in real terms between 2000 and 2021, reaching $3.7 trillion in 2021. Given its size, Asia was the main contributor to global agriculture, forestry and fishing value added with 65 percent of the world’s total in 2021.
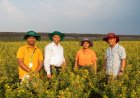
Agriculture employed some 873 million people in 2021, or 27 percent of the global workforce, compared with 1027 million or 40 percent in 2000.
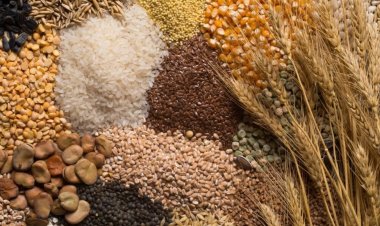
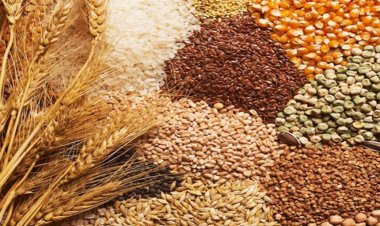
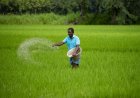
Global use of pesticide went up 62 percent between 2000 and 2021 with the Americas accounting for half the use in 2021. From 2000 to 2021, the production of primary crops grew by 54 percent reaching 9.5 billion tonnes. Four crops (sugarcane, maize, wheat and rice) accounted for half the total.
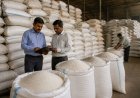
Cereals were the most traded commodity by quantity in 2021: the Americas and Europe are the largest exporters and Asia is the largest importer. With slightly less than one-third of the total, cereals were the main group of primary crops produced in 2021, followed by sugar crops (22 percent), vegetables and oil crops (12 percent each).
Greenhouse gas emissions from agrifood systems grew by 10 percent between 2000 and 2021. Farm-gate emissions account for nearly half of them.